Coagulants & Flocculants Market by Type (Aluminum & Sulphate, Aluminum & Chloride, Iron & Sulphate, Iron & Chloride, and Others), by End-Use Industry (Water & Wastewater Treatment, Mining, Power Generation, Chemical Processing, Heavy Media, and Others) - Global Trends & Forecasts to 2021


The global coagulants & flocculants market was worth USD 1.81 Billion in 2015 and is projected to reach USD 2.37 Billion by 2021, registering a CAGR of 4.80% between 2016 and 2021. The market for coagulants & flocculants is growing progressively and the trend is projected to continue in the next five years. The demand for coagulants & flocculants is high, as it is a low-cost procedure for the treatment of supply and drinking water and wastewater. Wide-scale developments in the water & wastewater treatment, oil & gas, power generation, mining, and desalination industries in emerging countries such as China, India, Brazil, Saudi Arabia, Qatar, and even in the African countries have led to the high demand for coagulants & flocculants. The base year considered for the study is 2014, while the forecast period is between 2015 and 2020 for estimating market size of coagulants & flocculants.
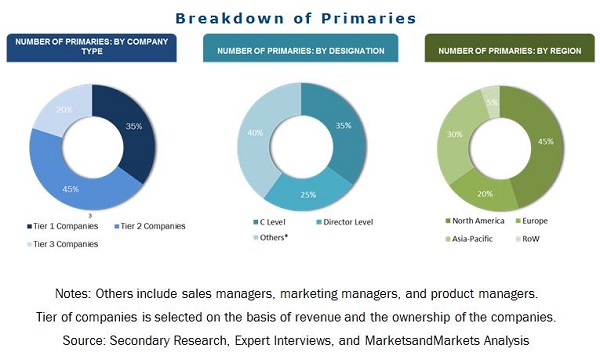
Different secondary sources such as company websites, encyclopedia, energy association reports, energy agencies, and databases have been used to identify and collect information that is useful for this extensive commercial study of the global coagulants & flocculants market. The primary sources include experts from related industries, who have been interviewed to verify and collect critical information as well as to assess the future prospects of the market. The top-down approach has been implemented to validate the market size in terms of value and volume. With the data triangulation procedure and validation of data through primaries, the exact values of the overall market size and individual market sizes have been determined and confirmed in this study.
The coagulants & flocculants market has a diversified and established ecosystem of upstream players such as raw material suppliers and downstream stakeholders such as manufacturers, vendors, end users, and government organizations. There are no specific raw material suppliers for this market as raw materials are supplied to the manufacturers through a network of middlemen and authorized distributors.
Target Audience
This study identifies the prospective high growth market segments in the next two to five years to help stakeholders prioritize their efforts and investments. The stakeholders in the global coagulants & flocculants market include:
- Coagulants & flocculants manufacturers
- Coagulants & flocculants traders, distributors, and suppliers
- Raw material suppliers
- Government and research organizations
- Oil & gas companies
- Water quality associations
Scope of the Report:
This research report categorizes the market for coagulants & flocculants based on type, application, and region. It forecasts the revenue growth and analysis of trends in each of the submarkets.
By Application:
- Water & wastewater treatment
- Mining
- Power generation
- Chemical processing
- Heavy media
- Others
By Type:
- Aluminum & sulphate
- Aluminum & chloride
- Iron & sulphate
- Iron & chloride
- Others
By Region:
- North America
- Europe
- APAC
- MEA and South America
This report also includes profiles of leading manufacturers such as GE Water & Process Technologies (U.S.), Ashland Inc. (U.S.), Kemira Oyj (Finland), Ecolab (U.S.), The Dow Chemical Company (U.S.), Akzonobel N.V. (Netherlands), and BASF SE (Germany).
Available Customizations: The following customization options are available in the report:
- Country-level, by application, and by type analysis and forecast
Analysis of coagulants & flocculants, by application, and by type market at country-level of every region
- Company Information
Analysis and profiling of additional global as well as regional market players (Up to 3)
 Exclusive indicates content/data unique to MarketsandMarkets and not available with any competitors.
Table of Contents
1 Introduction
1.1 Objectives of the Study
1.2 Market Definition
1.3 Scope of the Study
1.3.1 Markets Covered
1.3.2 Years Considered in the Report
1.4 Currency & Pricing
1.5 Package Size
1.6 Limitations
1.7 Stake Holders
2 Research Methodology
2.1 Research Data
2.1.1 Secondary Data
2.1.1.1 Key Data From Secondary Sources
2.1.2 Key Data From Primary Sources
2.1.2.1 Key Industry Insights
2.1.2.2 Breakdown of Primaries
2.2 Market Size Estimation
2.2.1 Bottom-Up Approach
2.2.2 Top-Down Approach
2.3 Market Breakdown & Data Triangulation
2.4 Research Assumptions
2.4.1 Assumptions
3 Executive Summary
4 Premium Insights
4.1 Significant Opportunities for Coagulants & Flocculants
4.2 Coagulants & Flocculants Market: Major Regions
4.3 Coagulants & Flocculants Market, By Application
4.6 Coagulants & Flocculants Market: Developed vs Developing Nations
4.7 Lifecycle Analysis, By Region, 2015
5 Market Overview
5.1 Introduction
5.2 Market Segmentation
5.3 Market Dynamics
5.3.1 Drivers
5.3.2 Restraints
5.3.3 Opportunities
5.4 Revenue Pocket Matrix
5.4.1 End-Use Indsutry Revenue Pocket for Tier 1 & 2
5.5 Formulation Processes By Type
6 Industry Trends
6.1 Introduction
6.2 Value Chain Analysis
6.2.1 List of Manufacturer
6.2.2 List of Raw Material and Technology Suppliers
6.2.3 List of Customers
6.2.4 List of Distributors
6.3 Porter’s Five Forces Analysis
6.4 Economic Indicator
6.4.1 Water & Wastewater Treatment
6.4.2 Mining
6.4.3 Power Generation
6.4.4 Chemical Processing
6.4.5 Heavy Media
6.5 Patents / Patent Trends
7 Greases Market, By Type
7.1 Introduction
7.2 Market Size & Projection
7.2.1 Aluminum & Sulphate
7.2.2 Aluminum & Chloride
7.2.3 Iron & Sulphate
7.2.4 Iron & Chloride
7.2.5 Others
8 Greases Market, By Application
8.1 Water & Wastewater Treatment
8.2 Mining
8.3 Power Generation
8.4 Chemical Processing
8.5 Heavy Media
8.6 Others
9 Greases Market, By Region
9.1 Introduction
9.2 Asia-Pacific
9.2.1 China
9.2.1.1 Economic Outlook
9.2.1.2 Market Size & Forecast
9.2.2 Japan
9.2.3 India
9.2.4 South Korea
9.2.5 Australia & New Zealand
9.2.6 Rest of the Asia
9.3 North America
9.3.1 U.S
9.3.2 Canada
9.4 Europe
9.4.1 Germany
9.4.2 Italy
9.4.3 France
9.4.4 U.K
9.4.5 Netherlands
9.4.5 Rest of the Europe
9.5 Middle East, Africa & Latin America
9.5.1 Brazil
9.5.2 Saudi Arabia
9.5.3 Mexico
9.5.4 Venezuela
9.5.5 Rest of MEA & LA
10 Competitive Landscape
10.1 Overview
10.2 Market Share Analysis
10.3 Competitive Benchmarking By Brands
10.4 The Most Adopted Growth Strategy
10.5 Maximum Developments
10.6 Competitive Situation & Trends
11 Company Profiles
(Overview, Financial*, Products & Services, Strategy, and Developments)
11.1 Regional Revenue Mix of Market Players
11.2 Ashland Corporation
11.3 Kemira Chemicals Inc.
11.4 The DOW Chemical Company
11.5 Akzo Nobel NV
11.6 Cortec Corporation
11.7 BASF SE
11.8 Ecolab (Nalco Company)
11.9 GE Water & Process Technologies
11.10 BWA Water Additives Uk Limited
11.11 Other Key Players*/Companies/Distributors Considered in the Report
11.11.1 Lonza Group Ltd.
11.11.2 Buckman Laboratories International Inc.
*Details Might Not Be Captured in Case of Unlisted Companies
12 Appendix
12.1 Excerpts From Industry Experts
12.2 Discussion Guide
12.3 Introducing RT: Real Time Market Intelligence
12.4 Available Customizations
12.5 Related Reports
List of Tables (94 Tables)
Table 1 Key Market Drivers
Table 2 Key Market Restraints
Table 3 Key Market Opportunities
Table 4 Key Market Challenges
Table 5 Global Coagulants & Flocculants Market Size, By Type, 2014-2021 (USD Million)
Table 6 Global Coagulants & Flocculants Market Size, By Type, 2014-2021 (Kilotons)
Table 7 Global Coagulants & Flocculants Market Size, By End-Use Industry, 2014-2021 (USD Million)
Table 8 Global Coagulants & Flocculants Market Size, By End-Use Industry, 2014-2021 (Kilotons)
Table 9 Aluminum & Sulphate: Global Coagulants & Flocculants Market Size, 2014-2021 (USD Million)
Table 10 Aluminum & Sulphate: Global Coagulants & Flocculants Market Size, 2014-2021 (Kilotons)
Table 11 Aluminum & Chloride : Global Coagulants & Flocculants Market Size, 2014-2021 (USD Million)
Table 12 Aluminum & Chloride : Global Coagulants & Flocculants Market Size, 2014-2021 (Kilotons)
Table 13 Iron & Sulphate : Global Coagulants & Flocculants Market Size, 2014-2021 (USD Million)
Table 14 Iron & Sulphate : Global Coagulants & Flocculants Market Size, 2014-2021 (Kilotons)
Table 15 Iron & Chloride: Global Coagulants & Flocculants Market Size, 2014-2021 (USD Million)
Table 16 Iron & Chloride: Global Coagulants & Flocculants Market Size, 2014-2021 (Kilotons)
Table 17 Others: Global Coagulants & Flocculants Market Size, 2014-2021 (USD Million)
Table 18 Others: Global Coagulants & Flocculants Market Size, 2014-2021 (Kilotons)
Table 19 Water & Wastewater Treatment: Global Coagulants & Flocculants Market Size, 2014-2021 (USD Million)
Table 20 Water & Wastewater Treatment: Global Coagulants & Flocculants Market Size, 2014-2021 (Kilotons)
Table 21 Mining: Global Coagulants & Flocculants Market Size, 2014-2021 (USD Million)
Table 22 Mining: Global Coagulants & Flocculants Market Size, 2014-2021 (Kilotons)
Table 23 Power Generation: Global Coagulants & Flocculants Market Size, 2014-2021 (USD Million)
Table 24 Power Generation: Global Coagulants & Flocculants Market Size, 2014-2021 (Kilotons)
Table 25 Chemical Processing: Global Coagulants & Flocculants Market Size, 2014-2021 (USD Million)
Table 26 Chemical Processing: Global Coagulants & Flocculants Market Size, 2014-2021 (Kilotons)
Table 27 Heavy Media: Global Coagulants & Flocculants Market Size, 2014-2021 (USD Million)
Table 28 Heavy Media: Global Coagulants & Flocculants Market Size, 2014-2021 (Kilotons)
Table 29 Others: Global Coagulants & Flocculants Market Size, 2014-2021 (USD Million)
Table 30 Others: Global Coagulants & Flocculants Market Size, 2014-2021 (Kilotons)
Table 31 North America: Coagulants & Flocculants Market Size, By Type, 2014-2021 (USD Million)
Table 32 North America: Coagulants & Flocculants Market Size, By Type, 2014-2021 (Kilotons)
Table 33 North America: Coagulants & Flocculants Market Size, By End-Use Industry, 2014-2021 (USD Million)
Table 34 North America: Coagulants & Flocculants Market Size, By End-Use Industry, 2014-2021 (Kilotons)
Table 35 North America: Coagulants & Flocculants Market Size, By Country, 2014-2021 (USD Million)
Table 36 North America: Coagulants & Flocculants Market Size, By Country, 2014-2021 (Kilotons)
Table 37 The U.S.: Coagulants & Flocculants Market Size, By End-Use Industry, 2014-2021 (USD Million)
Table 38 The U.S.: Coagulants & Flocculants Market Size, By End-Use Industry, 2014-2021 (Kilotons)
Table 39 Canada: Coagulants & Flocculants Market Size, By End-Use Industry, 2014-2021 (USD Million)
Table 40 Canada: Coagulants & Flocculants Market Size, By End-Use Industry, 2014-2021 (Kilotons)
Table 41 Europe: Coagulants & Flocculants Market Size, By Type, 2014-2021 (USD Million)
Table 42 Europe: Coagulants & Flocculants Market Size, By Type, 2014-2021 (Kilotons)
Table 43 Europe: Coagulants & Flocculants Market Size, By End-Use Industry, 2014-2021 (USD Million)
Table 44 Europe: Coagulants & Flocculants Market Size, By End-Use Industry, 2014-2021 (Kilotons)
Table 45 Europe: Coagulants & Flocculants Market Size, By Country, 2014-2021 (USD Million)
Table 46 Europe: Coagulants & Flocculants Market Size, By Country, 2014-2021 (Kilotons)
Table 47 Germany: Coagulants & Flocculants Market Size, By End-Use Industry, 2014-2021 (USD Million)
Table 48 Germany: Coagulants & Flocculants Market Size, By End-Use Industry, 2014-2021 (Kilotons)
Table 49 Italy: Coagulants & Flocculants Market Size, By End-Use Industry, 2014-2021 (USD Million)
Table 50 Italy: Coagulants & Flocculants Market Size, By End-Use Industry, 2014-2021 (Kilotons)
Table 51 France: Coagulants & Flocculants Market Size, By End-Use Industry, 2014-2021 (USD Million)
Table 52 France: Coagulants & Flocculants Market Size, By End-Use Industry, 2014-2021 (Kilotons)
Table 53 U.K.: Coagulants & Flocculants Market Size, By End-Use Industry, 2014-2021 (USD Million)
Table 54 U.K.: Global Coagulants & Flocculants Market Size, By End-Use Industry, 2014-2021 (Kilotons)
Table 55 Netherlands: Coagulants & Flocculants Market Size, By End-Use Industry, 2014-2021 (USD Million)
Table 56 Netherlands: Coagulants & Flocculants Market Size, By End-Use Industry, 2014-2021 (Kilotons)
Table 57 Rest of Europe: Coagulants & Flocculants Market Size, By End-Use Industry, 2014-2021 (USD Million)
Table 58 Rest of Europe: Coagulants & Flocculants Market Size, By End-Use Industry, 2014-2021 (Kilotons)
Table 59 Asia Pacific: Coagulants & Flocculants Market Size, By Type, 2014-2021 (USD Million)
Table 60 Asia Pacific: Coagulants & Flocculants Market Size, By Type, 2014-2021 (Kilotons)
Table 61 Asia Pacific: Coagulants & Flocculants Market Size, By End-Use Industry, 2014-2021 (USD Million)
Table 62 Asia Pacific: Coagulants & Flocculants Market Size, By End-Use Industry, 2014-2021 (Kilotons)
Table 63 Asia Pacific: Coagulants & Flocculants Market Size, By Country, 2014-2021 (USD Million)
Table 64 Asia Pacific: Coagulants & Flocculants Market Size, By Country, 2014-2021 (Kilotons)
Table 65 China: Coagulants & Flocculants Market Size, By End-Use Industry, 2014-2021 (USD Million)
Table 66 China: Coagulants & Flocculants Market Size, By End-Use Industry, 2014-2021 (Kilotons)
Table 67 Japan: Coagulants & Flocculants Market Size, By End-Use Industry, 2014-2021 (USD Million)
Table 68 Japan: Coagulants & Flocculants Market Size, By End-Use Industry, 2014-2021 (Kilotons)
Table 69 India: Coagulants & Flocculants Market Size, By End-Use Industry, 2014-2021 (USD Million)
Table 70 India: Coagulants & Flocculants Market Size, By End-Use Industry, 2014-2021 (Kilotons)
Table 71 South Korea: Coagulants & Flocculants Market Size, By End-Use Industry, 2014-2021 (USD Million)
Table 72 South Korea: Coagulants & Flocculants Market Size, By End-Use Industry, 2014-2021 (Kilotons)
Table 73 Australia & New Zealand: Coagulants & Flocculants Market Size, By End-Use Industry, 2014-2021 (USD Million)
Table 74 Australia & New Zealand: Coagulants & Flocculants Market Size, By End-Use Industry, 2014-2021 (Kilotons)
Table 75 Rest of APAC: Coagulants & Flocculants Market Size, By End-Use Industry, 2014-2021 (USD Million)
Table 76 Rest of APAC: Coagulants & Flocculants Market Size, By End-Use Industry, 2014-2021 (Kilotons)
Table 77 Middle East, Africa, and South America: Coagulants & Flocculants Market Size, By Type, 2014-2021 (USD Million)
Table 78 Middle East, Africa, and South America: Coagulants & Flocculants Market Size, By Type, 2014-2021 (Kilotons)
Table 79 Middle East, Africa, and South America: Coagulants & Flocculants Market Size, By End-Use Industry, 2014-2021 (USD Million)
Table 80 Middle East, Africa, and South America: Coagulants & Flocculants Market Size, By End-Use Industry, 2014-2021 (Kilotons)
Table 81 Middle East, Africa, and South America: Coagulants & Flocculants Market Size, By Country, 2014-2021 (USD Million)
Table 82 Middle East, Africa, and South America: Coagulants & Flocculants Market Size, By Country, 2014-2021 (Kilotons)
Table 83 Brazil: Coagulants & Flocculants Market Size, By End-Use Industry, 2014-2021 (USD Million)
Table 84 Brazil: Coagulants & Flocculants Market Size, By End-Use Industry, 2014-2021 (Kilotons)
Table 85 Saudi Arabia: Coagulants & Flocculants Market Size, By End-Use Industry, 2014-2021 (USD Million)
Table 86 Saudi Arabia: Coagulants & Flocculants Market Size, By End-Use Industry, 2014-2021 (Kilotons)
Table 87 UAE: Coagulants & Flocculants Market Size, By End-Use Industry, 2014-2021 (USD Million)
Table 88 UAE: Coagulants & Flocculants Market Size, By End-Use Industry, 2014-2021 (Kilotons)
Table 89 Mexico: Coagulants & Flocculants Market Size, By End-Use Industry, 2014-2021 (USD Million)
Table 90 Mexico: Coagulants & Flocculants Market Size, By End-Use Industry, 2014-2021 (Kilotons)
Table 91 Venezuela: Coagulants & Flocculants Market Size, By End-Use Industry, 2014-2021 (USD Million)
Table 92 Venezuela: Coagulants & Flocculants Market Size, By End-Use Industry, 2014-2021 (Kilotons)
Table 93 Rest of MEA & SA: Coagulants & Flocculants Market Size, By End-Use Industry, 2014-2021 (USD Million)
Table 94 Rest of MEA & SA: Coagulants & Flocculants Market Size, By End-Use Industry, 2014-2021 (Kilotons)
List of Figures (48 Figures)
Figure 1 Market Segmentation
Figure 2 Research Methodology
Figure 3 Production Facilities Concentration, 2014
Figure 4 Market Size Estimation Methodology: Bottom-Up Approach
Figure 5 Market Size Estimation Methodology: Top-Down Approach
Figure 6 Primary Interviews Split
Figure 7 Data Triangulation Model
Figure 8 Segments of Global Coagulants & Flocculants Market, By Type
Figure 9 Segments of Global Coagulants & Flocculants Market, By End-Use Industry
Figure 10 Segments of Global Coagulants & Flocculants Market, By Country
Figure 11 Market Penetration Level, By Country
Figure 12 Fastest Growing Regions
Figure 13 Key Observations on Most Attractive Regional Markets
Figure 14-23 Key Observations on Most Attractive Segments
Figure 24 Value Chain Analysis
Figure 25 Porter’s Five Forces Analysis
Figure 26 Raw Material Analysis
Figure 27 Pricing Analysis
Figure 28 Key Companies Growth Strategies Over the Last 5 Years
Figure 29 Top Performing Companies
Figure 30 Market Developments in Last 5 Years, By Key Players
Figure 31 Competitive Landscape: Key Observations
Figure 32 Battle for Market Share
Figure 33 Geographic Revenue Mix of Top 4 Market Players
Figure 34 Kemira Chemicals Inc.: Business Overview
Figure 35 Kemira Chemicals Inc.: SWOT Analysis
Figure 36 GE Power & Water Process Technologies: Business Overview
Figure 37 GE Power & Water Process Technologies: SWOT Analysis
Figure 38 The DOW Chemical Company: Business Overview
Figure 39 The DOW Chemical Company: SWOT Analysis
Figure 40 Akzonobel NV: Business Overview
Figure 41 Akzonobel NV: SWOT Analysis
Figure 42 BWA Water Additives: Business Overview
Figure 43 BASF SE: Business Overview
Figure 44 BASF SE: SWOT Analysis
Figure 45 Ashland Inc.: Business Overview
Figure 46 Ecolab (Nalco Company): Business Overview
Figure 47 Buckman Laboratories International Inc.: Business Overview
Figure 48 Cortec Corporation: Business Overview


Growth opportunities and latent adjacency in Coagulants & Flocculants Market